Smart cities and flagship stores: lighting fixtures
Smart city e flagship store: gli apparecchi per illuminazione
Illuminazione | Settembre 2021
€1600
RAPPORTO IN LINGUA INGLESE
Settembre 2021,
I Ed. ,
208 pagine
Prezzo (licenza per singolo utente):
EUR 1600 / USD 1744
Contattateci per licenze corporate e multiuser
Lingua: English
Codice report: S.86
Editore: CSIL
Status: soon available for online purchase and immediate download
Download
Indici dei contenuti

The goal of the Report ‘Smart cities and flagship stores: lighting fixtures’ is to provide:
- Lighting companies with a tool to identify potential locations where to set their mono-brand stores, keeping into account potential synergies (for instance the presence of complementary brands) as well as an indicator of the cost of the area;
- The industry, in general, with an analysis on the medium-term trends affecting the main cities worldwide.
The Report provides profiles of 85 cities worldwide with a selection of economic and demographic indicators (2013 and 2018), estimates of the potential market for lighting fixtures, in each city and the forecasts for the market development to the year 2023. The study also offers an analysis of the geographical presence of a selected sample of 65 brands, each of which operates as a trend-setter in its own category. Each identified location is characterized by its type (store, multibrand store, shopping centre) and the cost of the area in which they are located. The aim is, thus, to provide a comprehensive view of the cities that a selection of international retailers entered. Finally, each profile presents a selection of lighting stores and their geographical distribution.
In order to identify the position of each of these players in the selected cities, CSIL employed the technique of web scrapping. Web scraping (also called web harvesting, or web data extraction) is an IT technique of extracting data from a website using software programs. Usually, such programs simulate human browsing on the World Wide Web using the Hypertext Transfer Protocol (HTTP) or through browsers. After applying a system of filters, we managed to identified 4,809 locations across 85 cities.
Each location has been further characterized with two additional information: the type of store and the cost of the area. Using metadata, formatted addresses, and GPS coordinates, we managed to define whether the location is a store, a multi-brand retailer, or it is sited in a shopping centre. The residual category, ‘Else’, includes all the other type of locations: offices, warehouses, distribution centre, etc. Secondly, we managed to associate per each location the cost of the area in which it is sited. The cost is given by a proxy that is the average price of the hotel rooms per night for two persons in a given date (ante Covid-19) of all the hotels positioned within 1 km from the selected location. The price of the hotel rooms, their names and locations were collected implementing a second web-scraping tool. We managed to download the references for 71,132 hotels in 148 cities, no data were available for Tehran (Iran) and Khartum (Sudan). Then, the results were grouped into four categories: ‘Very Cheap’ (smaller than the first quartile), ‘Cheap’ (between the first and the second quartile), ‘Expensive’ (between the second and the third quartile), ‘Very Expensive’ (higher than the third quartile).
The same special analysis was implemented for the 85 selected cities focusing on furniture stores only. We geocalized the presence of 30 leading lighting brands in the selected cities. In addition, we look for the outlets registed with the metadata ‘lighting store’. After applying a system of filters, we managed to identified 3,008 locations across 84 cities. No data are available for Tianjin (China). Each location is characterized by the distance from the city centre (in Km), the number of reviews available on Google, the average value of these reviews (from 1 to 5), the website of the store whenever available
For each city profile, the following data, indicators and forecasts are provided:
- Population and its rank within the sample, 2013, 2018 and 2023
- Households and its rank within the sample, 2013, 2018 and 2023
- Gross domestic product per capita and its rank within the sample, 2013, 2018 and 2023
- Household’s consumption per capita and its rank within the sample, 2013, 2018 and 2023
- Gross domestic product and its rank within the sample, 2013, 2018 and 2023
- Household’s consumption and its rank within the sample, 2013, 2018 and 2023
- Breakdown of households by the level of income, 2013, 2018 and 2023
- Lighting fixtures demand and its growth rate, 2013, 2018 and 2023
- Lighting store sales (factory price) and its growth rate, 2013, 2018 and 2023
- Spatial analysis of the distribution of 50 brands within the city map
- Spatial analysis of the distribution of lighting outlets within the city map.
In order to minimize the problems arisen by the lack of a unique definition of city, CSIL decided to use demographic and economic data coming from a unique source, namely C-GIDD (www.cgidd.com). We access that database in January 2020, therefore macroeconomic estimations and forecasts were made before that date.
The world has changed dramatically in the recent months as the world has been put in a Great Lockdown. According to the IMF, ‘the magnitude and speed of collapse in activity that has followed is unlike anything experienced in our lifetimes‘. Up to the publication date of this report updates on forecasts up to 2023 haven’t be released. The only updates concern 2021. According to the IMF, ‘assuming the pandemic fades in the second half of 2020 and that policy actions taken around the world are effective in preventing widespread firm bankruptcies, extended job losses, and system-wide financial strains, we project global growth in 2021 to rebound to 5.8%. This recovery in 2021 is only partial as the level of economic activity is projected to remain below the level that we had projected for 2021, before the virus hit’.
Aziende selezionate
Among the selected lighting specialists mentioned:
Boonthavorn (Bangkok), IDC Otsuka (Tokyo), LEDS 4 Life (Cape Town), Yamagiwa (Osaka), LichtHaus (Berlin), Artemide SohO (New York), Flos Professional (Milan), DDesign (Copenhagen), B&B Italia (Miami), Occhio (Munich), Dallas Landscape Lighting, Trazzo Iluminacion (Lima); DMLights (Bruxelles), Dubai Lighting Center, Eglo (Kiev), Licht+Form (Munich), Panzeri & Partners (Berlin), Haute Living (Chicago), Kapoor Lamp Shades (Delhi), Viabizzuno (London, Panasonic Center (Tokyo), Foscarini (Milan), Technolight (Doha),
Among the lighting brands mentioned:
Artemide, Astro Lighting, Delta Light, Eglo, Endo, Flos, Foscarini, Ingo Maurer, Kichler, Kinglong, Koizumi, Kreon, Louis Poulsen, Maltani, Marset, Occhio, Opple, Osram, Philips, Quoizel, Signify, Sonnemann, Viabizzuno, Vibia, Wac Lighting, Xal, Zumtobel.

The lighting fixtures sector includes: lighting fixtures for indoor and outdoor applications, both with LED and conventional sources. CSIL monitors 70 countries selected on the basis of the importance of their lighting sector and contribution to the world furniture trade. Forecasts are prepared using macroeconomic data and projections provided by international organizations, as well as 30-year experience in the lighting fixtures industry. For the purpose of this report, the CSIL model was adjusted by taking into account an indicator measuring the dimension of the city based on the evolution of gross domestic product. This estimation is assumed to be true within a range of ± 10% from the reported data.
The reference global market, which includes lighting fixtures sold through lighting outlets at factory price, is estimated to be worth around 20% of the global lighting fixtures market. More specifically its share ranges from 16% and 24% depending on the metropolitan areas considered. Worldwide, lighting specialists account for approximately 12.5% of the total market. In addition, the reference market incorporates by some extent the contract segment (26%), Furniture retailers, department stores (8%), and e-commerce (10% to 20%). It does not include the more technical part of the contract segment (ex. street lighting, direct sales to final costumers), furniture chains (ex. Ikea, Wayfair), wholesalers (ex. Sonepar, Rexel), DIY (Obi, Home Depot), and pure e-tailers (ex. Amazon). This estimation, at city level, is assumed to be true within a range of ± 20% from the reported data.
Tokyo (JP), New York (USA), Seoul (KR), and Los Angeles (USA) emerged as the cities with the largest potential market for lighting fixtures. More specifically, their estimated potential markets are all lager than US$ 1 billion, Tokyo’s one exceeds US4 2 billion. Twelve cities have a potential market larger than half a billion dollars; they are London (UK), Paris (FR), Shanghai (CN), Chicago (USA), Beijing (CN), Osaka (CN), Guangzhou (CN), Washington (USA), Houston (USA), Dallas-Fort Worth (USA), Hong Kong (HK), and San Francisco (USA). Among the considered cities, Kiev (UA) and Cape Town (ZA) have the smallest potential lighting markets, with values lower than US$ 50 million. Other relatively small potential markets (lower than US$ 100 million) are located, in decreasing order, in Bangalore (IN), Amsterdam (NL), Jedda (SA), Lisbon (PT), Ankara (TR), Auckland (NZ), Saint Petersburg (RU), and Athens (GR).
Introduction
Contents of the Report; Research tools and methodological notes; Sample selection
City Profiles
Profiles of 85 cities worldwide with a selection of economic and demographic indicators, estimates and forecasts of the potential market for lighting fixtures
– Abu Dhabi, Amsterdam, Ankara, Athens, Atlanta, Auckland, Bangalore, Bangkok, Barcelona, Beijing, Berlin, Bogota, Boston, Brussels, Bucharest, Budapest, Buenos Aires, Cape Town, Chengdu, Chicago, Chongqing, Copenhagen, Dallas-Fort Worth, Delhi, Detroit, Doha, Dubai, Dublin, Frankfurt, Guangzhou, Helsinki, Ho Chi Minh City, Hong Kong, Houston, Istanbul, Jedda, Kiev, Kuala Lumpur, Lima, Lisbon, London, Los Angeles, Lyon, Madrid, Manchester, Melbourne, Mexico City, Miami, Milan, Minneapolis-Saint Paul, Montreal, Moscow, Mumbai, Munich, New York, Osaka, Oslo, Paris, Philadelphia, Phoenix, Prague, Rio De Janeiro, Riyadh, Rome, Saint Petersburg, San Diego, San Francisco, Santiago De Chile, Sao Paulo, Seattle, Seoul, Shanghai, Shenzhen, Singapore, Stockholm, Sydney, Tel Aviv-Jaffa, Tianjin, Tokyo, Toronto, Vancouver, Vienna, Warsaw, Washington, Zurich
For each city profile, the following data, indicators and forecasts are provided:
– City Highlights and Economic and business indicators: Population, Households, Gross domestic product, Gross domestic product per capita, Household’s consumption per capita and their rank within the sample, 2013, 2018 and 2023; Breakdown of households by the level of income, 2013, 2018 and 2023; lighting fixtures demand and its growth rate, 2013, 2018 and 2023.
– Flagship stores and distribution of lighting fixtures outlets: Spatial analysis of the distribution of 50 brands within the city map; Spatial distribution of a selection of lighting fixtures stores.
– Analysis of the geographical presence of a selected sample of 100 brands, with a focus on lighting fixtures stores.
Selected cities group by geographic areas:
Asia and Pacific: Melbourne, AU; Sydney, AU; Beijing, CN; Chengdu, CN; Chongqing, CN; Guangzhou, CN; Hangzhou, CN; Hong Kong, CN; Jinan, CN; Shanghai, CN; Tianjin, CN; Bangalore, IN; Mumbai, IN; Delhi, IN; Osaka, JP; Tokyo, JP; Seoul, KR; Kuala Lumpur-Klang Valley, MY; Auckland, NZ; Singapore, SG; Bangkok, TH; Ho Chi Minh City, VT.
Eastern Europe outside the EU and Russia: Moscow, RU; Saint Petersburg, RU; Ankara, TR; Istanbul, TR; Kiev, UA.
Europe: Vienna, AT; Brussels, BE; Prague, CZ; Copenhagen, DK; Helsinki, FI; Lyon, FR; Paris, FR; Berlin, DE; Frankfurt, DE; Munich, DE; Athens, GR; Budapest, HU; Dublin, IE; Milan, IT; Rome, IT; Amsterdam, NL; Oslo, NO; Warsaw, PO; Lisbon, PT; Bucharest, RO; Barcelona, ES; Madrid, ES; Stockholm, SE; Zurich, CH; London, UK; Manchester, UK.
Middle East and Africa: Tel Aviv-Jaffa, IL; Doha, QA; Jedda, SA; Riyadh, SA; Cape Town, ZA; Abu Dhabi, AE; Dubai, AE.
North America: Montreal, CA; Toronto, CA; Vancouver, CA; Mexico City, MX; Atlanta, US; Boston, US; Chicago, US; Dallas-Fort Worth, US; Detroit, US; Houston, US; Los Angeles, US; Miami, US; Minneapolis-Saint Paul, US; New York, US; Philadelphia, US; Phoenix, US; San Diego, US; San Francisco, US; Seattle, US; Washington, US.
South America: Buenos Aires, AR; Rio de Janeiro, BR; Sao Paulo, BR; Santiago de Chile, CL; Bogota, CO; Lima, PE.
Among the selected lighting specialists mentioned:
Boonthavorn (Bangkok), IDC Otsuka (Tokyo), LEDS 4 Life (Cape Town), Yamagiwa (Osaka), LichtHaus (Berlin), Artemide SohO (New York), Flos Professional (Milan), DDesign (Copenhagen), B&B Italia (Miami), Occhio (Munich), Dallas Landscape Lighting, Trazzo Iluminacion (Lima); DMLights (Bruxelles), Dubai Lighting Center, Eglo (Kiev), Licht+Form (Munich), Panzeri & Partners (Berlin), Haute Living (Chicago), Kapoor Lamp Shades (Delhi), Viabizzuno (London, Panasonic Center (Tokyo), Foscarini (Milan), Technolight (Doha).
Among the lighting brands mentioned:
Artemide, Astro Lighting, Delta Light, Eglo, Endo, Flos, Foscarini, Ingo Maurer, Kichler, Kinglong, Koizumi, Kreon, Louis Poulsen, Maltani, Marset, Occhio, Opple, Osram, Philips, Quoizel, Signify, Sonnemann, Viabizzuno, Vibia, Wac Lighting, Xal, Zumtobel.
The goal of the Report ‘Smart cities and flagship stores: lighting fixtures’ is to provide:
- Lighting companies with a tool to identify potential locations where to set their mono-brand stores, keeping into account potential synergies (for instance the presence of complementary brands) as well as an indicator of the cost of the area;
- The industry, in general, with an analysis on the medium-term trends affecting the main cities worldwide.
The Report provides profiles of 85 cities worldwide with a selection of economic and demographic indicators (2013 and 2018), estimates of the potential market for lighting fixtures, in each city and the forecasts for the market development to the year 2023. The study also offers an analysis of the geographical presence of a selected sample of 65 brands, each of which operates as a trend-setter in its own category. Each identified location is characterized by its type (store, multibrand store, shopping centre) and the cost of the area in which they are located. The aim is, thus, to provide a comprehensive view of the cities that a selection of international retailers entered. Finally, each profile presents a selection of lighting stores and their geographical distribution.
In order to identify the position of each of these players in the selected cities, CSIL employed the technique of web scrapping. Web scraping (also called web harvesting, or web data extraction) is an IT technique of extracting data from a website using software programs. Usually, such programs simulate human browsing on the World Wide Web using the Hypertext Transfer Protocol (HTTP) or through browsers. After applying a system of filters, we managed to identified 4,809 locations across 85 cities.
Each location has been further characterized with two additional information: the type of store and the cost of the area. Using metadata, formatted addresses, and GPS coordinates, we managed to define whether the location is a store, a multi-brand retailer, or it is sited in a shopping centre. The residual category, ‘Else’, includes all the other type of locations: offices, warehouses, distribution centre, etc. Secondly, we managed to associate per each location the cost of the area in which it is sited. The cost is given by a proxy that is the average price of the hotel rooms per night for two persons in a given date (ante Covid-19) of all the hotels positioned within 1 km from the selected location. The price of the hotel rooms, their names and locations were collected implementing a second web-scraping tool. We managed to download the references for 71,132 hotels in 148 cities, no data were available for Tehran (Iran) and Khartum (Sudan). Then, the results were grouped into four categories: ‘Very Cheap’ (smaller than the first quartile), ‘Cheap’ (between the first and the second quartile), ‘Expensive’ (between the second and the third quartile), ‘Very Expensive’ (higher than the third quartile).
The same special analysis was implemented for the 85 selected cities focusing on furniture stores only. We geocalized the presence of 30 leading lighting brands in the selected cities. In addition, we look for the outlets registed with the metadata ‘lighting store’. After applying a system of filters, we managed to identified 3,008 locations across 84 cities. No data are available for Tianjin (China). Each location is characterized by the distance from the city centre (in Km), the number of reviews available on Google, the average value of these reviews (from 1 to 5), the website of the store whenever available
For each city profile, the following data, indicators and forecasts are provided:
- Population and its rank within the sample, 2013, 2018 and 2023
- Households and its rank within the sample, 2013, 2018 and 2023
- Gross domestic product per capita and its rank within the sample, 2013, 2018 and 2023
- Household’s consumption per capita and its rank within the sample, 2013, 2018 and 2023
- Gross domestic product and its rank within the sample, 2013, 2018 and 2023
- Household’s consumption and its rank within the sample, 2013, 2018 and 2023
- Breakdown of households by the level of income, 2013, 2018 and 2023
- Lighting fixtures demand and its growth rate, 2013, 2018 and 2023
- Lighting store sales (factory price) and its growth rate, 2013, 2018 and 2023
- Spatial analysis of the distribution of 50 brands within the city map
- Spatial analysis of the distribution of lighting outlets within the city map.
In order to minimize the problems arisen by the lack of a unique definition of city, CSIL decided to use demographic and economic data coming from a unique source, namely C-GIDD (www.cgidd.com). We access that database in January 2020, therefore macroeconomic estimations and forecasts were made before that date.
The world has changed dramatically in the recent months as the world has been put in a Great Lockdown. According to the IMF, ‘the magnitude and speed of collapse in activity that has followed is unlike anything experienced in our lifetimes‘. Up to the publication date of this report updates on forecasts up to 2023 haven’t be released. The only updates concern 2021. According to the IMF, ‘assuming the pandemic fades in the second half of 2020 and that policy actions taken around the world are effective in preventing widespread firm bankruptcies, extended job losses, and system-wide financial strains, we project global growth in 2021 to rebound to 5.8%. This recovery in 2021 is only partial as the level of economic activity is projected to remain below the level that we had projected for 2021, before the virus hit’.
The lighting fixtures sector includes: lighting fixtures for indoor and outdoor applications, both with LED and conventional sources. CSIL monitors 70 countries selected on the basis of the importance of their lighting sector and contribution to the world furniture trade. Forecasts are prepared using macroeconomic data and projections provided by international organizations, as well as 30-year experience in the lighting fixtures industry. For the purpose of this report, the CSIL model was adjusted by taking into account an indicator measuring the dimension of the city based on the evolution of gross domestic product. This estimation is assumed to be true within a range of ± 10% from the reported data.
The reference global market, which includes lighting fixtures sold through lighting outlets at factory price, is estimated to be worth around 20% of the global lighting fixtures market. More specifically its share ranges from 16% and 24% depending on the metropolitan areas considered. Worldwide, lighting specialists account for approximately 12.5% of the total market. In addition, the reference market incorporates by some extent the contract segment (26%), Furniture retailers, department stores (8%), and e-commerce (10% to 20%). It does not include the more technical part of the contract segment (ex. street lighting, direct sales to final costumers), furniture chains (ex. Ikea, Wayfair), wholesalers (ex. Sonepar, Rexel), DIY (Obi, Home Depot), and pure e-tailers (ex. Amazon). This estimation, at city level, is assumed to be true within a range of ± 20% from the reported data.
Tokyo (JP), New York (USA), Seoul (KR), and Los Angeles (USA) emerged as the cities with the largest potential market for lighting fixtures. More specifically, their estimated potential markets are all lager than US$ 1 billion, Tokyo’s one exceeds US4 2 billion. Twelve cities have a potential market larger than half a billion dollars; they are London (UK), Paris (FR), Shanghai (CN), Chicago (USA), Beijing (CN), Osaka (CN), Guangzhou (CN), Washington (USA), Houston (USA), Dallas-Fort Worth (USA), Hong Kong (HK), and San Francisco (USA). Among the considered cities, Kiev (UA) and Cape Town (ZA) have the smallest potential lighting markets, with values lower than US$ 50 million. Other relatively small potential markets (lower than US$ 100 million) are located, in decreasing order, in Bangalore (IN), Amsterdam (NL), Jedda (SA), Lisbon (PT), Ankara (TR), Auckland (NZ), Saint Petersburg (RU), and Athens (GR).
Introduction
Contents of the Report; Research tools and methodological notes; Sample selection
City Profiles
Profiles of 85 cities worldwide with a selection of economic and demographic indicators, estimates and forecasts of the potential market for lighting fixtures
– Abu Dhabi, Amsterdam, Ankara, Athens, Atlanta, Auckland, Bangalore, Bangkok, Barcelona, Beijing, Berlin, Bogota, Boston, Brussels, Bucharest, Budapest, Buenos Aires, Cape Town, Chengdu, Chicago, Chongqing, Copenhagen, Dallas-Fort Worth, Delhi, Detroit, Doha, Dubai, Dublin, Frankfurt, Guangzhou, Helsinki, Ho Chi Minh City, Hong Kong, Houston, Istanbul, Jedda, Kiev, Kuala Lumpur, Lima, Lisbon, London, Los Angeles, Lyon, Madrid, Manchester, Melbourne, Mexico City, Miami, Milan, Minneapolis-Saint Paul, Montreal, Moscow, Mumbai, Munich, New York, Osaka, Oslo, Paris, Philadelphia, Phoenix, Prague, Rio De Janeiro, Riyadh, Rome, Saint Petersburg, San Diego, San Francisco, Santiago De Chile, Sao Paulo, Seattle, Seoul, Shanghai, Shenzhen, Singapore, Stockholm, Sydney, Tel Aviv-Jaffa, Tianjin, Tokyo, Toronto, Vancouver, Vienna, Warsaw, Washington, Zurich
For each city profile, the following data, indicators and forecasts are provided:
– City Highlights and Economic and business indicators: Population, Households, Gross domestic product, Gross domestic product per capita, Household’s consumption per capita and their rank within the sample, 2013, 2018 and 2023; Breakdown of households by the level of income, 2013, 2018 and 2023; lighting fixtures demand and its growth rate, 2013, 2018 and 2023.
– Flagship stores and distribution of lighting fixtures outlets: Spatial analysis of the distribution of 50 brands within the city map; Spatial distribution of a selection of lighting fixtures stores.
– Analysis of the geographical presence of a selected sample of 100 brands, with a focus on lighting fixtures stores.
Selected cities group by geographic areas:
Asia and Pacific: Melbourne, AU; Sydney, AU; Beijing, CN; Chengdu, CN; Chongqing, CN; Guangzhou, CN; Hangzhou, CN; Hong Kong, CN; Jinan, CN; Shanghai, CN; Tianjin, CN; Bangalore, IN; Mumbai, IN; Delhi, IN; Osaka, JP; Tokyo, JP; Seoul, KR; Kuala Lumpur-Klang Valley, MY; Auckland, NZ; Singapore, SG; Bangkok, TH; Ho Chi Minh City, VT.
Eastern Europe outside the EU and Russia: Moscow, RU; Saint Petersburg, RU; Ankara, TR; Istanbul, TR; Kiev, UA.
Europe: Vienna, AT; Brussels, BE; Prague, CZ; Copenhagen, DK; Helsinki, FI; Lyon, FR; Paris, FR; Berlin, DE; Frankfurt, DE; Munich, DE; Athens, GR; Budapest, HU; Dublin, IE; Milan, IT; Rome, IT; Amsterdam, NL; Oslo, NO; Warsaw, PO; Lisbon, PT; Bucharest, RO; Barcelona, ES; Madrid, ES; Stockholm, SE; Zurich, CH; London, UK; Manchester, UK.
Middle East and Africa: Tel Aviv-Jaffa, IL; Doha, QA; Jedda, SA; Riyadh, SA; Cape Town, ZA; Abu Dhabi, AE; Dubai, AE.
North America: Montreal, CA; Toronto, CA; Vancouver, CA; Mexico City, MX; Atlanta, US; Boston, US; Chicago, US; Dallas-Fort Worth, US; Detroit, US; Houston, US; Los Angeles, US; Miami, US; Minneapolis-Saint Paul, US; New York, US; Philadelphia, US; Phoenix, US; San Diego, US; San Francisco, US; Seattle, US; Washington, US.
South America: Buenos Aires, AR; Rio de Janeiro, BR; Sao Paulo, BR; Santiago de Chile, CL; Bogota, CO; Lima, PE.
Among the selected lighting specialists mentioned:
Boonthavorn (Bangkok), IDC Otsuka (Tokyo), LEDS 4 Life (Cape Town), Yamagiwa (Osaka), LichtHaus (Berlin), Artemide SohO (New York), Flos Professional (Milan), DDesign (Copenhagen), B&B Italia (Miami), Occhio (Munich), Dallas Landscape Lighting, Trazzo Iluminacion (Lima); DMLights (Bruxelles), Dubai Lighting Center, Eglo (Kiev), Licht+Form (Munich), Panzeri & Partners (Berlin), Haute Living (Chicago), Kapoor Lamp Shades (Delhi), Viabizzuno (London, Panasonic Center (Tokyo), Foscarini (Milan), Technolight (Doha).
Among the lighting brands mentioned:
Artemide, Astro Lighting, Delta Light, Eglo, Endo, Flos, Foscarini, Ingo Maurer, Kichler, Kinglong, Koizumi, Kreon, Louis Poulsen, Maltani, Marset, Occhio, Opple, Osram, Philips, Quoizel, Signify, Sonnemann, Viabizzuno, Vibia, Wac Lighting, Xal, Zumtobel.
RAPPORTI CORRELATI
The worldwide market for connected lighting (english)
Febbraio 2024,
I Ed. ,
88 pagine
Il mercato mondiale dell'illuminazione connessa
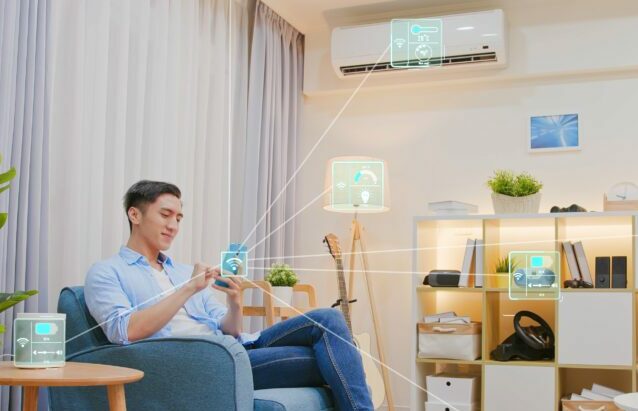
Questo rapporto analizza il mercato globale dell’illuminazione concentrandosi sulle tendenze dei LED e dell’illuminazione connessa. Fornisce previsioni di mercato sottolineando l’impatto della transizione green e della trasformazione digitale. Lo studio include anche una sezione sulla concorrenza del settore, stimando le vendite e le quote di mercato dei principali produttori.
Lighting: World Market Outlook (English)
Novembre 2023,
XXVI Ed. ,
123 pagine
Il mercato mondiale dell'illuminazione
La ventiseiesima edizione della ricerca CSIL “Lighting: World market outlook” analizza, attraverso tabelle e grafici, i dati relativi alla produzione, al consumo e al commercio internazionale di apparecchi di illuminazione a livello mondiale nel suo complesso con un focus su 70 Paesi, per gli anni 2013-2022 e i preliminari del 2023. Sono inoltre fornite previsioni di mercato per i prossimi tre anni (2024-2026).
The lighting fixtures market in China (English)
Settembre 2023,
XVI Ed. ,
205 pagine
Il mercato degli apparecchi per illuminazione in Cina
La 16a edizione di The Lighting Fixtures market in China offre un’analisi accurata e approfondita del settore degli apparecchi di illuminazione in Cina, fornendo dati e tendenze per il periodo 2017-2022 e previsioni fino al 2025. Da un lato, il rapporto analizza le principali tendenze che hanno interessato il mercato negli ultimi cinque anni, considerando la produzione, il consumo, le importazioni e le esportazioni di apparecchi di illuminazione nel Paese. Dall’altro, offre un’analisi della struttura dell’offerta e del sistema competitivo, una panoramica sul trend dell’ illuminazione connessa/smart, il sistema di distribuzione e i principali attori che operano nel mercato.
The lighting fixtures market in the United States (English)
Giugno 2023,
XVII Ed. ,
256 pagine
Il mercato degli apparecchi per illuminazione negli Stati Uniti
Il mercato statunitense dell’illuminazione nel 2022 registra una crescita del 6,5% in termini nominali per quanto riguarda gli apparecchi di illuminazione (consumer, professionale, per esterni), fino a 23,2 miliardi di dollari. Il mercato delle lampade registra un calo (circa -2,9%). Il segmento residenziale è cresciuto ben oltre la media del mercato (+5,9% in media negli ultimi cinque anni). Nel 2022, il peso degli uffici e dell’intrattenimento sul mercato complessivo dell’illuminazione commerciale è diminuito, mentre sono cresciuti i locali pubblici e l’ospitalità. Nel 2022, il valore delle costruzioni completate è cresciuto di oltre il 10%, raggiungendo quasi 1,8 miliardi di dollari.
The European market for lighting fixtures (English)
Maggio 2023,
XXXII Ed. ,
392 pagine
Il mercato europeo degli apparecchi per illuminazione
Nel 2022, il consumo di apparecchi di illuminazione nei Paesi dell’UE30 ha registrato un aumento dell’8,3%, raggiungendo un valore di 19,9 miliardi di euro. Risultati migliori per l’illuminazione commerciale (rispetto a quella residenziale, industriale e per esterni), per i grandi operatori (con un Ebitda del 12%), per il design, per l’illuminazione di aree, per l’ospitalità, per il contract (rispetto alla vendita al dettaglio), per l’illuminazione lineare e per l’emergenza. Più brevetti IP e acquisizioni. I primi 10 operatori detengono una quota di mercato del 30%.