The office furniture market in Poland, Hungary, Czech Republic and Romania
Ufficio | Giugno 2014
€1600

RAPPORTO IN LINGUA INGLESE
Giugno 2014,
VII Ed. ,
115 pagine
Prezzo (licenza per singolo utente):
EUR 1600 / USD 1712
Contattateci per licenze corporate e multiuser
Lingua: English
Codice report: S08
Editore: CSIL
Status: available for online purchase and immediate download
Download
Indici dei contenuti
This report offers a comprehensive picture of the office furniture market in Poland, Hungary, Czech Republic and Romania, providing trends in office furniture production and consumption, office furniture imports and exports. Office furniture distribution channels are also examined.
For each country the main economic indicators are provided. Forecast for 2014 is included. Office furniture imports and exports are broken down by country and geographical area.
The office furniture supply structure is analyzed, with data on companies and employment. Short profiles are provided for the main office furniture companies, with data on office furniture sales and market shares of the leading local producers and of the main foreign manufacturers operating in Poland, Hungary, Czech Republic and Romania.
The report is enriched by an in-depth analysis of the competitive system in terms of company size, manufacturing locations, financial ratios and product breakdown.
The analysis of office furniture distribution channels covers: direct sales, dealers, large scale distribution, mail order and e-commerce. Data on the major office furniture distributors are provided.
Addresses of about 130 office furniture companies mentioned in the report are also included.
Countries covered: Czech Republic, Hungary, Poland, Romania.
Products covered include: office furniture, office seating, contract, operative desk, executive furniture, filing and storage, wall to wall units, furniture for communal areas.
Office furniture production is reported by segment (office seating, operative desks, executive furniture, office storage, wall to wall units).
An analysis of the market potential focuses on data about building permits, 2020 growth for selected towns, available office spaces.
Aziende selezionate
Antares International, Ares Line, Balma, Bejot, Bene , Black, Red & White, Bruynzeel Filing and Storage, C+P Systemy Meblowe, Dietiker, Elvila, Bodzio, Fafem, Falco Sopron, Famos Sp., Forte, Furniko, , Garzon Haworth Europe, Herman Miller, Hon, Kinnarps, Kovona System, Malow, Maro, Martela Sp. Z. o. o. (Martela OY), Martex, MDD , Mikomax, Mobexpert Nowy Styl, Parisot, Profim, Rim CZ, Sinetica, Sitland, Steelcase, Stulwerk, Swisschair Corp, Szynaka Meble, Techo (Ahrend Group), Ton, Topstar, Ultra-Plus, Wiesner-Hager, Wuteh
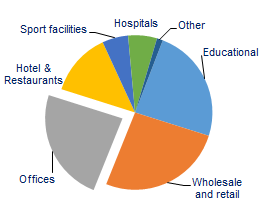
Breakdown of non residential building surfaces. % shares on total square metres.

In 2013 total office furniture production in the four countries studied was worth Euro 735 million, recording an increase of about 2% compared to 2012. Positive outlook for 2014 and 2015 is given for Poland, Czech Republic and Romania. Production has been mainly sustained by export activities, which increased by 12.4%. About 590 million square metres of non-residential buildings are currently available in the countries considered. Approximately 24% (140 million square metres) of this grand total is represented by offices. Average EBITDA margin for the analyzed companies on a five years span has been about 8.3%. Top 50 manufacturers hold around 75% of the office furniture industry in Poland, Czech Republic, Hungary and Romania
Abstract of Table of Contents
Methodology
1. Market Overview
1.1 The office furniture sector: basic data
- Poland, Hungary, the Czech Republic and Romania. Office furniture. Basic data, 2008-2013. Eur million
- Poland, Hungary, the Czech Republic and Romania. Office furniture. The openness of the market, 2008-2013. Percentage values
1.2 Drivers of office furniture demand
1.3 Expectations for 2014
- Poland, Hungary, the Czech Republic and Romania. GDP projections for 2014 and 2015. Annual % change in real terms
- Poland, Hungary and the Czech Republic. Total investments. Annual % change in real terms
- World office furniture consumption. Forecasts by region, 2014. Percentage change in real terms.
1.4 Leading manufacturers and product segments
1.5 Financial indicators
- Balance sheets. The sample. Percentage shares
- Financial indicators in a sample of manufacturers. Million EUR and EBTDA
1.6 Market shares
- Poland, Hungary, the Czech Republic and Romania. Sales of office furniture in a sample of companies, 2013
FOR POLAND, HUNGARY, CZECH REPUBLIC AND ROMANIA:
The office furniture sector: basic data
- production, apparent consumption, imports, exports, 2008-2013. Eur million
International trade
- Exports by country and by geographical area of office furniture excluding seating
- Exports by country and by geographical area of office seating
- Imports by country and by geographical area of office furniture excluding seating
- Imports by country and by geographical area of office seating
Office furniture competition and market shares
- Leading office furniture manufacturers, 2013. Eur million and %
- Sales of office furniture in a sample of companies, 2013
Distribution channels
Drivers of office furniture demand
Associations, Sector fairs and magazines
Appendix I: List of companies mentioned in the report
This report offers a comprehensive picture of the office furniture market in Poland, Hungary, Czech Republic and Romania, providing trends in office furniture production and consumption, office furniture imports and exports. Office furniture distribution channels are also examined.
For each country the main economic indicators are provided. Forecast for 2014 is included. Office furniture imports and exports are broken down by country and geographical area.
The office furniture supply structure is analyzed, with data on companies and employment. Short profiles are provided for the main office furniture companies, with data on office furniture sales and market shares of the leading local producers and of the main foreign manufacturers operating in Poland, Hungary, Czech Republic and Romania.
The report is enriched by an in-depth analysis of the competitive system in terms of company size, manufacturing locations, financial ratios and product breakdown.
The analysis of office furniture distribution channels covers: direct sales, dealers, large scale distribution, mail order and e-commerce. Data on the major office furniture distributors are provided.
Addresses of about 130 office furniture companies mentioned in the report are also included.
Countries covered: Czech Republic, Hungary, Poland, Romania.
Products covered include: office furniture, office seating, contract, operative desk, executive furniture, filing and storage, wall to wall units, furniture for communal areas.
Office furniture production is reported by segment (office seating, operative desks, executive furniture, office storage, wall to wall units).
An analysis of the market potential focuses on data about building permits, 2020 growth for selected towns, available office spaces.
Breakdown of non residential building surfaces. % shares on total square metres.

In 2013 total office furniture production in the four countries studied was worth Euro 735 million, recording an increase of about 2% compared to 2012. Positive outlook for 2014 and 2015 is given for Poland, Czech Republic and Romania. Production has been mainly sustained by export activities, which increased by 12.4%. About 590 million square metres of non-residential buildings are currently available in the countries considered. Approximately 24% (140 million square metres) of this grand total is represented by offices. Average EBITDA margin for the analyzed companies on a five years span has been about 8.3%. Top 50 manufacturers hold around 75% of the office furniture industry in Poland, Czech Republic, Hungary and Romania
Abstract of Table of Contents
Methodology
1. Market Overview
1.1 The office furniture sector: basic data
- Poland, Hungary, the Czech Republic and Romania. Office furniture. Basic data, 2008-2013. Eur million
- Poland, Hungary, the Czech Republic and Romania. Office furniture. The openness of the market, 2008-2013. Percentage values
1.2 Drivers of office furniture demand
1.3 Expectations for 2014
- Poland, Hungary, the Czech Republic and Romania. GDP projections for 2014 and 2015. Annual % change in real terms
- Poland, Hungary and the Czech Republic. Total investments. Annual % change in real terms
- World office furniture consumption. Forecasts by region, 2014. Percentage change in real terms.
1.4 Leading manufacturers and product segments
1.5 Financial indicators
- Balance sheets. The sample. Percentage shares
- Financial indicators in a sample of manufacturers. Million EUR and EBTDA
1.6 Market shares
- Poland, Hungary, the Czech Republic and Romania. Sales of office furniture in a sample of companies, 2013
FOR POLAND, HUNGARY, CZECH REPUBLIC AND ROMANIA:
The office furniture sector: basic data
- production, apparent consumption, imports, exports, 2008-2013. Eur million
International trade
- Exports by country and by geographical area of office furniture excluding seating
- Exports by country and by geographical area of office seating
- Imports by country and by geographical area of office furniture excluding seating
- Imports by country and by geographical area of office seating
Office furniture competition and market shares
- Leading office furniture manufacturers, 2013. Eur million and %
- Sales of office furniture in a sample of companies, 2013
Distribution channels
Drivers of office furniture demand
Associations, Sector fairs and magazines
Appendix I: List of companies mentioned in the report
RAPPORTI CORRELATI
The world office furniture industry (English)
Dicembre 2023,
XII Ed. ,
442 pagine
L'industria mondiale dei mobili per ufficio
Panoramica del settore mondiale dell’arredo ufficio con dati di produzione, consumo, importazioni ed esportazioni 2014-2023, commercio internazionale, previsioni di mercato 2024 e 2025, profili dei principali produttori e le tabelle di sintesi per 60 Paesi. Focus sui 20 principali paesi produttori di mobili per ufficio.
The World Market for Height Adjustable Tables (English)
Novembre 2023,
I Ed. ,
80 pagine
Il mercato mondiale delle scrivanie regolabili in altezza
Rapporto dettagliato sul settore mondiale delle scrivanie regolabili in altezza (HAT), che analizza le tendenze e le previsioni di mercato per le principali aree geografiche e regioni nel mondo, i maggiori player (produttori e fornitori), la destinazione di prodotto.
The world market for office seating (English)
Novembre 2023,
II Ed. ,
162 pagine
Il mercato mondiale delle sedute per ufficio
Rapporto dettagliato che analizza il settore mondiale delle sedute per ufficio, con dati di produzione, consumo e commercio internazionale per la serie storica 2018-2023, previsioni del mercato 2024 e 2025, il sistema competitivo, le diverse tipologie di prodotto e le loro caratteristiche, con un focus su tre aree (Nord America, Europa e Asia-Pacifico) e paesi chiave.
The office furniture market in North America: the United States, Canada and Mexico (English)
Luglio 2023,
VII Ed. ,
129 pagine
Il mercato dei mobili per ufficio in Nord America: Stati Uniti, Canada e Messico
Analisi dell’industria dei mobili per ufficio in Nord America, con focus su Stati Uniti, Canada e Messico. Valore del mercato e previsioni, dati per paese, quote di mercato delle aziende leader, canali distributivi.
The European market for office furniture (English)
Giugno 2023,
XXXV Ed. ,
281 pagine
Il mercato europeo dei mobili per ufficio
Analisi dettagliata del settore dei mobili per ufficio in Europa: dati storici, principali indicatori e dati di base, prospettive della domanda, sistema competitivo e performance dei principali produttori, categorie di prodotto e distribuzione.


