The lighting fixtures market in Australia and New Zealand
Il mercato degli apparecchi per illuminazione in Australia e Nuova Zelanda
Illuminazione | Dicembre 2017
€1600
RAPPORTO IN LINGUA INGLESE
Dicembre 2017,
III Ed. ,
100 pagine
Prezzo (licenza per singolo utente):
EUR 1600 / USD 1744
Contattateci per licenze corporate e multiuser
Lingua: English
Codice report: S72.AU
Editore: CSIL
Status: available for online purchase and immediate download
Download
Indici dei contenuti

AUSTRALIA SECTION
The report ‘The lighting fixtures market in Australia‘ is at its third edition. It provides data and trend (2011-2016) on production, international trade and market size of the lighting fixtures industry in Australia, broken down by consumer/residential and technical/professional lighting.
The analysis also provides a breakdown of the Australian lighting fixtures exports and imports by country and by geographical area of destination/origin. The lighting demand of the Australian market is broken down by segment (consumer/residential lighting, architectural/commercial lighting, industrial lighting and outdoor lighting) and by light source (Conventional and LED). A focus on LED lighting is provided throughout historical data and forecasts up to 2021. An overview of the geographic distribution of the industry is presented.
The competitive system analyses the main companies present in the Australian lighting fixtures market (by segment), with data on sales, market shares, and short company profiles.
A breakdown of the distribution channels of lighting fixtures in Australia is given, together with short profiles of a sample of lighting fixture distributors. Covered channels are: direct sales and contract; lighting fixtures specialists; furniture stores/chains, department stores, DIY; Wholesalers; E-commerce sales.
A list of selected architectural companies involved in the Australian lighting business and Lighting designers is given. The main fairs, events, and organizations related to the lighting industry are presented.
Country economic indicators (including GDP, Inflation, population indicators, building construction indicators) are also provided, together with macroeconomic forecasts up to 2021.
NEW ZEALAND SECTION
The report ‘The lighting fixtures market in New Zealand‘ is at its third edition. It provides historical data for the period 2011-2016 of production, international trade and market size of the lighting fixtures industry in New Zealand.
The study offers a breakdown of New Zealand lighting fixtures exports and imports by country and by geographical area of destination/origin. The lighting demand is broken down by segment (consumer/residential lighting, architectural/commercial lighting, industrial lighting and outdoor lighting) and by light source (Conventional and LED).
The competitive system analyses the main companies present in the local lighting fixtures market, with data on sales, market shares and short company profiles.
Country economic indicators (including GDP, Inflation, population indicators) are also provided, together with macroeconomic forecasts up to 2021.
Aziende selezionate
Advanced Lighting Technologies, Beacon Lighting, Clipsal, Domus Lighting, Emerald Planet, Evolt, Fagerhult Group, Famco Lighting, Gerard Lighting Group, Halcyon Lighting, Haneco Lighting, Harcroft, Hunza Productions, Ikea Australia, LED Group, Osram Group, Philips Lighting Group, Rakumba Lighting, Yusing Lighting, Zumtobel Group
Australia and New Zealand. Market dimension, import penetration, average annual growth. Million USD, % shares, %change
")
With a value of almost USD 1.3 billion in 2016, Australia is estimated to account for 1.4% of the worldwide lighting fixtures consumption. Approximately 74% of its consumption is satisfied by imported lighting fixtures. This share has been progressively increasing, especially in the residential segment, where Chinese imports have been substituting the local production. Overall, Australia is a net importer, with a trade deficit of USD 861 million. In 2016, the share of LED-base lighting fixtures was approximately 45% of the market; it is forecasted to reach 65% of the total market by 2021. In the country, the top 50 players hold more than 75%, the professional segment emerged to be more concentrated than the consumer one.
In 2016, the market for lighting fixtures in New Zealand was worth less than one-fifth of the Australian one, approximately USD 241 million with an increase of 8% compared to 2015. Over the last five years, it has shown an average annual growth of almost +13%. In New Zealand, the lighting fixtures market is even more open to foreign players than the Australian one, as 80% of its consumption is satisfied by imported lighting fixtures. In 2016, the LED-base lighting fixtures segment amounted to USD 110 million and the top 50 players hold more than 75% of the total market.
1. BASIC DATA AND ACTIVITY TREND
Australia and New Zealand. Lighting fixtures production, export, import and consumption, 2011-2016: Total, Residential and Technical Lighting
2. INTERNATIONAL TRADE
Australia and New Zealand. Lighting fixtures exports and imports by country of destination/origin and by geographical area, 2011-2016
3. MARKET STRUCTURE
Australia and New Zealand. Lighting fixtures. Sales breakdown by market segment: consumer/residential, architectural/commercial, industrial and outdoor lighting.
Australia and New Zealand. LED based lighting fixtures sales, 2010-2016 estimated data and 2017-2021 forecasts.
Australia. LED based lighting fixtures sales and market shares of 50 among the leading companies
Australia. Geographic distribution of a sample of companies.
Australia. Number of employees for a sample of companies
4. DISTRIBUTION
Australia and New Zealand. Lighting fixtures. Sales breakdown by distribution channel and short company profiles (Direct Sales and Contract, Lighting Specialists, Department Stores, Furniture Retailers and Furniture Chains, DIY and Home Centres, Lifestyle Concept Stores, Wholesalers and Home Builders, E-Commerce)
Australia and New Zealand. Short profiles of a list of selected distributors.
Australia and New Zealand. Architectural and Design companies involved in the lighting business
Australia and New Zealand. Fair, events, organizations related to the lighting business
5. COMPETITIVE SYSTEM
Australia and New Zealand. Lighting fixtures sales and market shares of 50 among the leading companies
Australia. Lighting fixtures sales and market shares of leading companies broken down by segment (residential, commercial, industrial, outdoor).
New Zealand. Residential and Technical lighting fixtures sales and market shares for a sample of leading companies.
6. MACROECONOMIC INDICATORS
Australia and New Zealand. Population indicators, Country Indicators, GDP and inflation (historical data and forecasts up to 2022)
AUSTRALIA SECTION
The report ‘The lighting fixtures market in Australia‘ is at its third edition. It provides data and trend (2011-2016) on production, international trade and market size of the lighting fixtures industry in Australia, broken down by consumer/residential and technical/professional lighting.
The analysis also provides a breakdown of the Australian lighting fixtures exports and imports by country and by geographical area of destination/origin. The lighting demand of the Australian market is broken down by segment (consumer/residential lighting, architectural/commercial lighting, industrial lighting and outdoor lighting) and by light source (Conventional and LED). A focus on LED lighting is provided throughout historical data and forecasts up to 2021. An overview of the geographic distribution of the industry is presented.
The competitive system analyses the main companies present in the Australian lighting fixtures market (by segment), with data on sales, market shares, and short company profiles.
A breakdown of the distribution channels of lighting fixtures in Australia is given, together with short profiles of a sample of lighting fixture distributors. Covered channels are: direct sales and contract; lighting fixtures specialists; furniture stores/chains, department stores, DIY; Wholesalers; E-commerce sales.
A list of selected architectural companies involved in the Australian lighting business and Lighting designers is given. The main fairs, events, and organizations related to the lighting industry are presented.
Country economic indicators (including GDP, Inflation, population indicators, building construction indicators) are also provided, together with macroeconomic forecasts up to 2021.
NEW ZEALAND SECTION
The report ‘The lighting fixtures market in New Zealand‘ is at its third edition. It provides historical data for the period 2011-2016 of production, international trade and market size of the lighting fixtures industry in New Zealand.
The study offers a breakdown of New Zealand lighting fixtures exports and imports by country and by geographical area of destination/origin. The lighting demand is broken down by segment (consumer/residential lighting, architectural/commercial lighting, industrial lighting and outdoor lighting) and by light source (Conventional and LED).
The competitive system analyses the main companies present in the local lighting fixtures market, with data on sales, market shares and short company profiles.
Country economic indicators (including GDP, Inflation, population indicators) are also provided, together with macroeconomic forecasts up to 2021.
Australia and New Zealand. Market dimension, import penetration, average annual growth. Million USD, % shares, %change
With a value of almost USD 1.3 billion in 2016, Australia is estimated to account for 1.4% of the worldwide lighting fixtures consumption. Approximately 74% of its consumption is satisfied by imported lighting fixtures. This share has been progressively increasing, especially in the residential segment, where Chinese imports have been substituting the local production. Overall, Australia is a net importer, with a trade deficit of USD 861 million. In 2016, the share of LED-base lighting fixtures was approximately 45% of the market; it is forecasted to reach 65% of the total market by 2021. In the country, the top 50 players hold more than 75%, the professional segment emerged to be more concentrated than the consumer one.
In 2016, the market for lighting fixtures in New Zealand was worth less than one-fifth of the Australian one, approximately USD 241 million with an increase of 8% compared to 2015. Over the last five years, it has shown an average annual growth of almost +13%. In New Zealand, the lighting fixtures market is even more open to foreign players than the Australian one, as 80% of its consumption is satisfied by imported lighting fixtures. In 2016, the LED-base lighting fixtures segment amounted to USD 110 million and the top 50 players hold more than 75% of the total market.
1. BASIC DATA AND ACTIVITY TREND
Australia and New Zealand. Lighting fixtures production, export, import and consumption, 2011-2016: Total, Residential and Technical Lighting
2. INTERNATIONAL TRADE
Australia and New Zealand. Lighting fixtures exports and imports by country of destination/origin and by geographical area, 2011-2016
3. MARKET STRUCTURE
Australia and New Zealand. Lighting fixtures. Sales breakdown by market segment: consumer/residential, architectural/commercial, industrial and outdoor lighting.
Australia and New Zealand. LED based lighting fixtures sales, 2010-2016 estimated data and 2017-2021 forecasts.
Australia. LED based lighting fixtures sales and market shares of 50 among the leading companies
Australia. Geographic distribution of a sample of companies.
Australia. Number of employees for a sample of companies
4. DISTRIBUTION
Australia and New Zealand. Lighting fixtures. Sales breakdown by distribution channel and short company profiles (Direct Sales and Contract, Lighting Specialists, Department Stores, Furniture Retailers and Furniture Chains, DIY and Home Centres, Lifestyle Concept Stores, Wholesalers and Home Builders, E-Commerce)
Australia and New Zealand. Short profiles of a list of selected distributors.
Australia and New Zealand. Architectural and Design companies involved in the lighting business
Australia and New Zealand. Fair, events, organizations related to the lighting business
5. COMPETITIVE SYSTEM
Australia and New Zealand. Lighting fixtures sales and market shares of 50 among the leading companies
Australia. Lighting fixtures sales and market shares of leading companies broken down by segment (residential, commercial, industrial, outdoor).
New Zealand. Residential and Technical lighting fixtures sales and market shares for a sample of leading companies.
6. MACROECONOMIC INDICATORS
Australia and New Zealand. Population indicators, Country Indicators, GDP and inflation (historical data and forecasts up to 2022)
RAPPORTI CORRELATI
The worldwide market for connected lighting (english)
Febbraio 2024,
I Ed. ,
88 pagine
Il mercato mondiale dell'illuminazione connessa
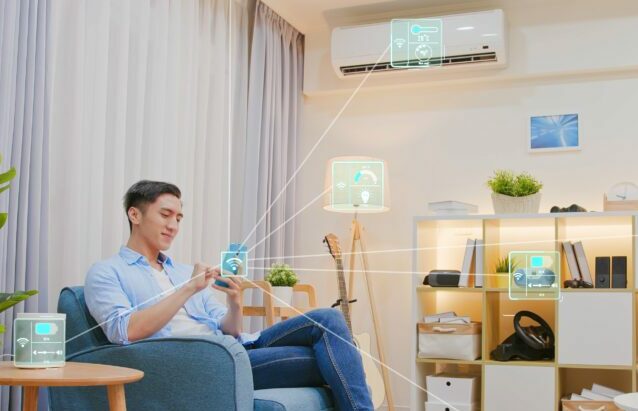
Questo rapporto analizza il mercato globale dell’illuminazione concentrandosi sulle tendenze dei LED e dell’illuminazione connessa. Fornisce previsioni di mercato sottolineando l’impatto della transizione green e della trasformazione digitale. Lo studio include anche una sezione sulla concorrenza del settore, stimando le vendite e le quote di mercato dei principali produttori.
Lighting: World Market Outlook (English)
Novembre 2023,
XXVI Ed. ,
123 pagine
Il mercato mondiale dell'illuminazione
La ventiseiesima edizione della ricerca CSIL “Lighting: World market outlook” analizza, attraverso tabelle e grafici, i dati relativi alla produzione, al consumo e al commercio internazionale di apparecchi di illuminazione a livello mondiale nel suo complesso con un focus su 70 Paesi, per gli anni 2013-2022 e i preliminari del 2023. Sono inoltre fornite previsioni di mercato per i prossimi tre anni (2024-2026).
The lighting fixtures market in China (English)
Settembre 2023,
XVI Ed. ,
205 pagine
Il mercato degli apparecchi per illuminazione in Cina
La 16a edizione di The Lighting Fixtures market in China offre un’analisi accurata e approfondita del settore degli apparecchi di illuminazione in Cina, fornendo dati e tendenze per il periodo 2017-2022 e previsioni fino al 2025. Da un lato, il rapporto analizza le principali tendenze che hanno interessato il mercato negli ultimi cinque anni, considerando la produzione, il consumo, le importazioni e le esportazioni di apparecchi di illuminazione nel Paese. Dall’altro, offre un’analisi della struttura dell’offerta e del sistema competitivo, una panoramica sul trend dell’ illuminazione connessa/smart, il sistema di distribuzione e i principali attori che operano nel mercato.
The lighting fixtures market in the United States (English)
Giugno 2023,
XVII Ed. ,
256 pagine
Il mercato degli apparecchi per illuminazione negli Stati Uniti
Il mercato statunitense dell’illuminazione nel 2022 registra una crescita del 6,5% in termini nominali per quanto riguarda gli apparecchi di illuminazione (consumer, professionale, per esterni), fino a 23,2 miliardi di dollari. Il mercato delle lampade registra un calo (circa -2,9%). Il segmento residenziale è cresciuto ben oltre la media del mercato (+5,9% in media negli ultimi cinque anni). Nel 2022, il peso degli uffici e dell’intrattenimento sul mercato complessivo dell’illuminazione commerciale è diminuito, mentre sono cresciuti i locali pubblici e l’ospitalità. Nel 2022, il valore delle costruzioni completate è cresciuto di oltre il 10%, raggiungendo quasi 1,8 miliardi di dollari.
The European market for lighting fixtures (English)
Maggio 2023,
XXXII Ed. ,
392 pagine
Il mercato europeo degli apparecchi per illuminazione
Nel 2022, il consumo di apparecchi di illuminazione nei Paesi dell’UE30 ha registrato un aumento dell’8,3%, raggiungendo un valore di 19,9 miliardi di euro. Risultati migliori per l’illuminazione commerciale (rispetto a quella residenziale, industriale e per esterni), per i grandi operatori (con un Ebitda del 12%), per il design, per l’illuminazione di aree, per l’ospitalità, per il contract (rispetto alla vendita al dettaglio), per l’illuminazione lineare e per l’emergenza. Più brevetti IP e acquisizioni. I primi 10 operatori detengono una quota di mercato del 30%.