December 2017,
III Ed. ,
100 pages
Price (single user license):
EUR 1600 / USD 1728
For multiple/corporate license prices please contact us
Language: English
Report code: S72.AU
Publisher: CSIL
Status: available for online purchase and immediate download
Download
Table of contents
AUSTRALIA SECTION
The report ‘The lighting fixtures market in Australia‘ is at its third edition. It provides data and trend (2011-2016) on production, international trade and market size of the lighting fixtures industry in Australia, broken down by consumer/residential and technical/professional lighting.
The analysis also provides a breakdown of the Australian lighting fixtures exports and imports by country and by geographical area of destination/origin. The lighting demand of the Australian market is broken down by segment (consumer/residential lighting, architectural/commercial lighting, industrial lighting and outdoor lighting) and by light source (Conventional and LED). A focus on LED lighting is provided throughout historical data and forecasts up to 2021. An overview of the geographic distribution of the industry is presented.
The competitive system analyses the main companies present in the Australian lighting fixtures market (by segment), with data on sales, market shares, and short company profiles.
A breakdown of the distribution channels of lighting fixtures in Australia is given, together with short profiles of a sample of lighting fixture distributors. Covered channels are: direct sales and contract; lighting fixtures specialists; furniture stores/chains, department stores, DIY; Wholesalers; E-commerce sales.
A list of selected architectural companies involved in the Australian lighting business and Lighting designers is given. The main fairs, events, and organizations related to the lighting industry are presented.
Country economic indicators (including GDP, Inflation, population indicators, building construction indicators) are also provided, together with macroeconomic forecasts up to 2021.
NEW ZEALAND SECTION
The report ‘The lighting fixtures market in New Zealand‘ is at its third edition. It provides historical data for the period 2011-2016 of production, international trade and market size of the lighting fixtures industry in New Zealand.
The study offers a breakdown of New Zealand lighting fixtures exports and imports by country and by geographical area of destination/origin. The lighting demand is broken down by segment (consumer/residential lighting, architectural/commercial lighting, industrial lighting and outdoor lighting) and by light source (Conventional and LED).
The competitive system analyses the main companies present in the local lighting fixtures market, with data on sales, market shares and short company profiles.
Country economic indicators (including GDP, Inflation, population indicators) are also provided, together with macroeconomic forecasts up to 2021.
Selected companies
Advanced Lighting Technologies, Beacon Lighting, Clipsal, Domus Lighting, Emerald Planet, Evolt, Fagerhult Group, Famco Lighting, Gerard Lighting Group, Halcyon Lighting, Haneco Lighting, Harcroft, Hunza Productions, Ikea Australia, LED Group, Osram Group, Philips Lighting Group, Rakumba Lighting, Yusing Lighting, Zumtobel Group
Australia and New Zealand. Market dimension, import penetration, average annual growth. Million USD, % shares, %change
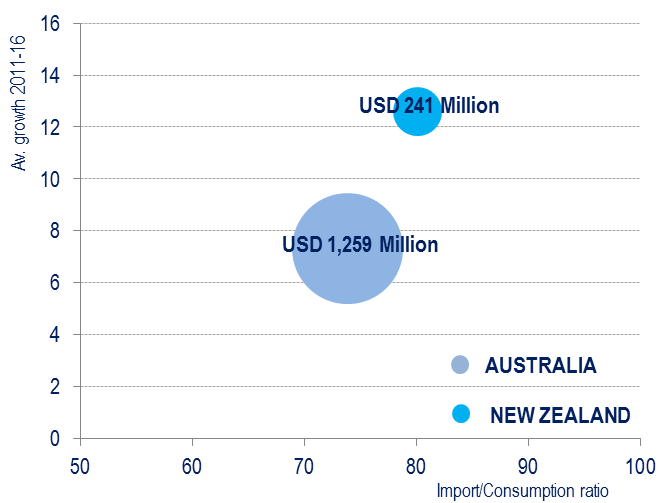
With a value of almost USD 1.3 billion in 2016, Australia is estimated to account for 1.4% of the worldwide lighting fixtures consumption. Approximately 74% of its consumption is satisfied by imported lighting fixtures. This share has been progressively increasing, especially in the residential segment, where Chinese imports have been substituting the local production. Overall, Australia is a net importer, with a trade deficit of USD 861 million. In 2016, the share of LED-base lighting fixtures was approximately 45% of the market; it is forecasted to reach 65% of the total market by 2021. In the country, the top 50 players hold more than 75%, the professional segment emerged to be more concentrated than the consumer one.
In 2016, the market for lighting fixtures in New Zealand was worth less than one-fifth of the Australian one, approximately USD 241 million with an increase of 8% compared to 2015. Over the last five years, it has shown an average annual growth of almost +13%. In New Zealand, the lighting fixtures market is even more open to foreign players than the Australian one, as 80% of its consumption is satisfied by imported lighting fixtures. In 2016, the LED-base lighting fixtures segment amounted to USD 110 million and the top 50 players hold more than 75% of the total market.
1. BASIC DATA AND ACTIVITY TREND
Australia and New Zealand. Lighting fixtures production, export, import and consumption, 2011-2016: Total, Residential and Technical Lighting
2. INTERNATIONAL TRADE
Australia and New Zealand. Lighting fixtures exports and imports by country of destination/origin and by geographical area, 2011-2016
3. MARKET STRUCTURE
Australia and New Zealand. Lighting fixtures. Sales breakdown by market segment: consumer/residential, architectural/commercial, industrial and outdoor lighting.
Australia and New Zealand. LED based lighting fixtures sales, 2010-2016 estimated data and 2017-2021 forecasts.
Australia. LED based lighting fixtures sales and market shares of 50 among the leading companies
Australia. Geographic distribution of a sample of companies.
Australia. Number of employees for a sample of companies
4. DISTRIBUTION
Australia and New Zealand. Lighting fixtures. Sales breakdown by distribution channel and short company profiles (Direct Sales and Contract, Lighting Specialists, Department Stores, Furniture Retailers and Furniture Chains, DIY and Home Centres, Lifestyle Concept Stores, Wholesalers and Home Builders, E-Commerce)
Australia and New Zealand. Short profiles of a list of selected distributors.
Australia and New Zealand. Architectural and Design companies involved in the lighting business
Australia and New Zealand. Fair, events, organizations related to the lighting business
5. COMPETITIVE SYSTEM
Australia and New Zealand. Lighting fixtures sales and market shares of 50 among the leading companies
Australia. Lighting fixtures sales and market shares of leading companies broken down by segment (residential, commercial, industrial, outdoor).
New Zealand. Residential and Technical lighting fixtures sales and market shares for a sample of leading companies.
6. MACROECONOMIC INDICATORS
Australia and New Zealand. Population indicators, Country Indicators, GDP and inflation (historical data and forecasts up to 2022)
AUSTRALIA SECTION
The report ‘The lighting fixtures market in Australia‘ is at its third edition. It provides data and trend (2011-2016) on production, international trade and market size of the lighting fixtures industry in Australia, broken down by consumer/residential and technical/professional lighting.
The analysis also provides a breakdown of the Australian lighting fixtures exports and imports by country and by geographical area of destination/origin. The lighting demand of the Australian market is broken down by segment (consumer/residential lighting, architectural/commercial lighting, industrial lighting and outdoor lighting) and by light source (Conventional and LED). A focus on LED lighting is provided throughout historical data and forecasts up to 2021. An overview of the geographic distribution of the industry is presented.
The competitive system analyses the main companies present in the Australian lighting fixtures market (by segment), with data on sales, market shares, and short company profiles.
A breakdown of the distribution channels of lighting fixtures in Australia is given, together with short profiles of a sample of lighting fixture distributors. Covered channels are: direct sales and contract; lighting fixtures specialists; furniture stores/chains, department stores, DIY; Wholesalers; E-commerce sales.
A list of selected architectural companies involved in the Australian lighting business and Lighting designers is given. The main fairs, events, and organizations related to the lighting industry are presented.
Country economic indicators (including GDP, Inflation, population indicators, building construction indicators) are also provided, together with macroeconomic forecasts up to 2021.
NEW ZEALAND SECTION
The report ‘The lighting fixtures market in New Zealand‘ is at its third edition. It provides historical data for the period 2011-2016 of production, international trade and market size of the lighting fixtures industry in New Zealand.
The study offers a breakdown of New Zealand lighting fixtures exports and imports by country and by geographical area of destination/origin. The lighting demand is broken down by segment (consumer/residential lighting, architectural/commercial lighting, industrial lighting and outdoor lighting) and by light source (Conventional and LED).
The competitive system analyses the main companies present in the local lighting fixtures market, with data on sales, market shares and short company profiles.
Country economic indicators (including GDP, Inflation, population indicators) are also provided, together with macroeconomic forecasts up to 2021.
Australia and New Zealand. Market dimension, import penetration, average annual growth. Million USD, % shares, %change

With a value of almost USD 1.3 billion in 2016, Australia is estimated to account for 1.4% of the worldwide lighting fixtures consumption. Approximately 74% of its consumption is satisfied by imported lighting fixtures. This share has been progressively increasing, especially in the residential segment, where Chinese imports have been substituting the local production. Overall, Australia is a net importer, with a trade deficit of USD 861 million. In 2016, the share of LED-base lighting fixtures was approximately 45% of the market; it is forecasted to reach 65% of the total market by 2021. In the country, the top 50 players hold more than 75%, the professional segment emerged to be more concentrated than the consumer one.
In 2016, the market for lighting fixtures in New Zealand was worth less than one-fifth of the Australian one, approximately USD 241 million with an increase of 8% compared to 2015. Over the last five years, it has shown an average annual growth of almost +13%. In New Zealand, the lighting fixtures market is even more open to foreign players than the Australian one, as 80% of its consumption is satisfied by imported lighting fixtures. In 2016, the LED-base lighting fixtures segment amounted to USD 110 million and the top 50 players hold more than 75% of the total market.
1. BASIC DATA AND ACTIVITY TREND
Australia and New Zealand. Lighting fixtures production, export, import and consumption, 2011-2016: Total, Residential and Technical Lighting
2. INTERNATIONAL TRADE
Australia and New Zealand. Lighting fixtures exports and imports by country of destination/origin and by geographical area, 2011-2016
3. MARKET STRUCTURE
Australia and New Zealand. Lighting fixtures. Sales breakdown by market segment: consumer/residential, architectural/commercial, industrial and outdoor lighting.
Australia and New Zealand. LED based lighting fixtures sales, 2010-2016 estimated data and 2017-2021 forecasts.
Australia. LED based lighting fixtures sales and market shares of 50 among the leading companies
Australia. Geographic distribution of a sample of companies.
Australia. Number of employees for a sample of companies
4. DISTRIBUTION
Australia and New Zealand. Lighting fixtures. Sales breakdown by distribution channel and short company profiles (Direct Sales and Contract, Lighting Specialists, Department Stores, Furniture Retailers and Furniture Chains, DIY and Home Centres, Lifestyle Concept Stores, Wholesalers and Home Builders, E-Commerce)
Australia and New Zealand. Short profiles of a list of selected distributors.
Australia and New Zealand. Architectural and Design companies involved in the lighting business
Australia and New Zealand. Fair, events, organizations related to the lighting business
5. COMPETITIVE SYSTEM
Australia and New Zealand. Lighting fixtures sales and market shares of 50 among the leading companies
Australia. Lighting fixtures sales and market shares of leading companies broken down by segment (residential, commercial, industrial, outdoor).
New Zealand. Residential and Technical lighting fixtures sales and market shares for a sample of leading companies.
6. MACROECONOMIC INDICATORS
Australia and New Zealand. Population indicators, Country Indicators, GDP and inflation (historical data and forecasts up to 2022)
SEE ALSO
The worldwide market for connected lighting
February 2024, I Ed. , 88 pages
This report analyses the global lighting market focusing on LED and connected lighting trends. It provides market forecasts emphasizing the impact of green transition and digital transformation. The study also includes a section on industry competition, estimating sales, and market shares for leading manufacturers.
Lighting: World Market Outlook
November 2023, XXVI Ed. , 123 pages
The world market for lighting fixtures reached a value of USD 97 billion in 2023. After some fluctuating performance in the post-pandemic period, it is expected to remain stable in 2024, followed by moderate growth in 2025 and 2026. The major consuming countries are the US, China, Japan, India and Germany. The twenty-six edition of CSIL research “Lighting: World market outlook” analyzes, through tables and graphs, data on lighting fixtures production, consumption and international trade at worldwide level as a whole and for 70 considered countries, for the years 2013-2022 and 2023 preliminary. lighting fixtures market forecasts for the next three years (2024-2026) are also provided
The lighting fixtures market in China
September 2023, XVI Ed. , 205 pages
The 16th edition of The Lighting Fixtures market in China offers an accurate and in-deep analysis of the lighting fixtures industry in China, providing data and trends for the period 2017-2022 and forecasts up to 2025. From one hand, the report analyses the main trends affecting the market over the last five years, considering the production, consumption, imports and exports of lighting fixtures in the country. On the other hand, it offers an analysis of the supply structure and the competitive system, an overview on smart connected lighting trend, the distribution system and the main players operating in the market
The lighting fixtures market in the United States
June 2023, XVII Ed. , 256 pages
The total US lighting market is estimated to be worth around USD 26 billion in 2022. This value includes lighting fixtures and lamps. The US lighting market during 2022 registers a 6.5% growth in nominal terms as for lighting fixtures (consumer, professional, outdoor), up to 23.2 billion USD. The lamps market registers a decrease (about -2.9%). The residential segment has grown well above the market average (+5.9% on average over the last five years). In 2022, the weight of Office and Entertainment on the overall commercial lighting market has declined, while Hospitality and Public premises grew. In 2022, the value of completed construction grew by more than 10 percent to nearly USD 1.8 billion
The European market for lighting fixtures
May 2023, XXXII Ed. , 392 pages
In 2022, consumption of lighting fixtures in the EU30 countries registered a 8.3% increase, reaching a value of EUR 19.9 billion. Better results for commercial lighting (versus residential, industrial and outdoor), big players (with a 12% Ebitda), design oriented, area lighting, hospitality, contract (versus retail), linear lighting, emergency. More IP patents and acquisitions. Top 10 players hold a 30% market share.
